
I met Jessi Cisewski-Kehe in 2015 when she gave a talk for the department of statistics at Virginia Tech. She spoke about her work in the astrostatistics field, which I had never heard of. The Harvard and Smithsonian Center for Astrophysics defines astrostatistics as “the way astronomers measure the reliability of their measurements, quantify the uncertainties in theoretical models, and turn the raw numbers from observations into something useful.” The statistical aspects of this work are not trivial by any means, but rest assured Jessi is having an awesome career untangling the statistical mysteries in our universe, literally.
When and how did you discover the statistics field?
After college, I worked at Allstate Insurance Company for a couple years as a business actuary. There were also research actuaries, and many of them had a master’s degree or PhD in statistics. The research actuaries gave fascinating presentations to the business actuaries. I was not always able to understand the material, but it seemed really cool and useful. Eventually, I thought it could be a good idea to pursue a PhD in statistics and joined the program at UNC-Chapel Hill.
My original thought was to get my PhD and then be a research actuary, but very quickly, I realized how much I enjoyed academia and wanted to stay. Eventually, I started working with my thesis adviser, Jan Hannig, on topics related to generalized fiducial inference. At some point in my second or third year, I obtained an Institute of Mathematical Statistics bulletin about astronomy and statistics. That was when I first heard about the field of astrostatistics. It sounded like exactly what I should be doing because I always loved astronomy. I thought, for my next research direction, I’d pursue some area within astrostatistics.
To prepare, I audited an undergraduate introduction to astronomy course. Then, I enrolled in an undergraduate cosmology course. It was the second in the sequence. Since it was an undergraduate course, I could not earn credit, but enrolling compelled me to actually do the work. The cosmology course taught me intuition and jargon that continues to help me communicate better with astronomers.
Looking back, these introductory, not-for-credit astronomy courses were incredibly helpful to you in your career, but they were not related to your thesis or required to graduate at that time?
Correct. I think that if a statistician is interested in interdisciplinary work and does not already have the domain expertise to communicate with the domain experts, I would recommend taking an undergraduate course on a relevant topic. Graduate-level courses typically assume some base knowledge, so it can be harder to actually get the intuition you need. But introductory undergraduate courses are often tailored for people with limited knowledge of a field.
For my undergraduate cosmology course, it turned out the instructor was just phenomenal. Her name is Sheila Kannappan and she’s an astronomy professor at UNC-Chapel Hill. Because the course was so effective, I was able to pick up the jargon and intuition I needed.
Before you and I met, I just sort of imagined the universe as a very intricate but unvarying clock. So, I’m curious, what sorts and sources of uncertainty do astrostatisticians grapple with?
There are lots of types of uncertainty that depend on the area of astronomy, but I’ll touch upon a few areas as examples. An important way astronomers gain information about the universe is from light sources that are very, very far away. For example, some astronomers are looking to find exoplanets, which are planets orbiting a star outside our solar system.
The basic understanding is that most stars will have one or more planets, but the planets can be challenging to detect. Standard imaging approaches don’t work for most exoplanets because, for example, they are too far away and too small compared to their host star. For the most part, exoplanets are indirectly observed.
Often, the indirect exoplanet signal is very, very tiny. Photometry is one way to detect exoplanets. It works by observing the brightness of the star across time. This was the approach of NASA’s Kepler mission. They were observing a whole field of around 100,000 stars and looking at the brightness of each star across time. If a periodic dip in the brightness of the star is observed over time, then that could suggest a transiting planet—a planet that orbits between the telescope and star and blocks a little bit of the light.
These observations of brightness over time are the data, and there is uncertainty in those measurements due to photon noise, instrumental uncertainties, etc. One question is whether a signal due to an exoplanet blocking a tiny bit of the light from a star is there or not relative to uncertainty in the measurements. Certain properties of the exoplanet can also be derived from the shape of the transit, such as its depth.
There is also estimation and statistical modeling in some of the work I do with exoplanets using spectroscopy data. Instead of a field of stars, only a single star is observed at a time. With spectroscopy, you get a much more detailed view of the brightness of the star. It measures how the light is distributed across wavelengths. In this setting, the spectroscopy data—the spectra—are used to detect a wobble of the host star. This detection method is called the radial velocity method. If the star is moving toward us, its light is blue-shifted. If it is moving away from us, the light is red-shifted. You end up with kind of a functional time series of light intensities that indicate the star’s movement with respect to the instrument.
We use the observed spectra to determine if there is a wobble in the star that could plausibly be explained by a planet orbiting the star. A certain periodic wobble suggests a planet is orbiting.
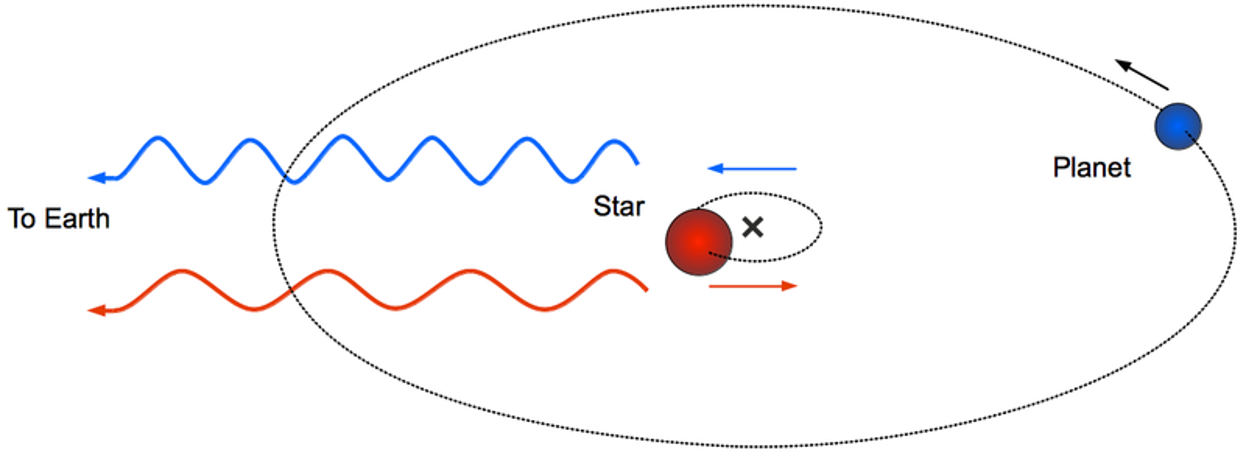
From each spectrum of starlight, we can use different methods to estimate the radial velocity of the star. If there is a planet orbiting the star, we expect to see a sinusoidal-like signal when plotting the radial velocity of the star versus time. These data also have uncertainty since there is instrumental error and Poisson uncertainty from the photon counts. On top of those sources, the star is not solid, but rather a ball of plasma with magnetic activity. The magnetic activity produces phenomena like starspots. You may be familiar with sunspots, which are dark spots on the sun that rotate with the star. But these different variability sources in the atmosphere of the star affect the spectrum, which affects the radial velocity signal, which can hide these tiny, tiny shifts due to an exoplanet. Or, perhaps worse, they can mimic the tiny, tiny shifts, making it look like there is a planet when there is not one.
In summary, there are many sources of uncertainty in the observed spectra. The question becomes, “Do we see a particular sinusoidal shift in spectra in the light from a star that would indicate the star’s movement is influenced by a planet, or is the observed light more plausibly due to noise or these other sources of variability?” There are several methods to try to answer these questions, but no clear solution when trying to detect low-mass exoplanets such as Earth analogs.
Another major source of uncertainty in astronomy is distance estimation. How far away is a star? How far away is a galaxy? How far away is a quasar? Very far away. A variety of techniques are used to estimate distances as different scales, and they all come with uncertainty. Even estimating the distance to a star in our Milky Way using the so-called parallax method has significant uncertainty.
There’s also general observational biases. For example, the inverse-square law of light implies we will only be able to see the brightest objects at greater and greater distances. We end up missing objects that are not as bright at these great distances, but that doesn’t mean they aren’t there.
To conclude, many of the sources of uncertainty are due to the nature of light and how we can measure it. There are general issues of whether an object is there, what the object is, and how you classify it.
What can you tell us about the functions used in these modeling approaches?
In the exoplanet setting where you observe there’s a sinusoid-like signal due to a planet orbiting a star, we use the radial velocity curve. That’s the radial velocity of the star versus time. If there’s, say, a single planet, the shape of the radial velocity curve depends on the eccentricity of the orbit, the mass of the star, the mass of the planet, the period of the orbit, etc. A physics-based model known as a Keplerian model is used to define the shape of the curve.
What are some of the tools astrostatisticians need to be familiar with to understand celestial objects? Could a regular statistician become an amateur astrostatistician with these tools?
I think most statisticians interested in working in the astronomy, astrophysics, or cosmology field probably already have some useful tools astronomers would be interested in for a problem. It’s just a matter of finding the right astronomer.
The astronomy field has many types of data and methods needs. Astronomical data come in many forms such as point clouds, images, and functions. Often, data are confined to a sphere or other manifolds. There is a wide variety of types of data and quantity of data.
Some phenomena have not been observed frequently because they’re hard to observe or do not occur frequently. For example, gravitational waves are very hard to observe. The first gravitational wave signal wasn’t directly observed until 2015 by the LIGO collaboration.
There are phenomena with only a small sample size, so techniques for small data sets are necessary. For example, astronomers are interested in the habitability of exoplanets. At this point, we have a sample size of one known habitable planet: Earth. They are looking for signatures of life on other planets.
Moving forward, there are telescopes being constructed that are going to bring in so much data we’re not going to know what to do with it all! The Legacy Survey of Space and Time at the Rubin Observatory in Chile will take pictures of the entire southern sky about every three days. The estimate I’ve seen is there will be about 20 TB of image data every night of operation. They’re going to have tons and tons of objects to be identified and classified and other phenomena to analyze.
There are many ways statisticians can get involved in astronomy research. If you’re interested in pursuing astrostatistics, finding a good astronomy collaborator is going to be quite useful. There are so many intricacies and details and important information about an astronomy data set that it would be hard to just take a data set from somewhere in astronomy and use it in a way that’s actually reasonable … unless it is pre-packaged like in various data analysis competitions.
Many astronomers seem interested in working with statisticians and computer scientists, and they’re eager to learn new methods. If you happen to have a method you think could possibly be useful in astronomy, try to talk to an astronomer. Maybe give a seminar for an astronomy department at your institution or nearby or do a virtual talk. If you present to an astronomer or an astronomy audience, there is a good chance someone will follow up with you.
It sounds like there are many existing and emerging needs for statisticians in astronomy. And collaboration might be the key for a statistician to get their foot in the door.
Agreed.
Do astronomers ever just see something, some signal, but they don’t know what it might be?
Yeah, well, first I’d say even experts will be puzzled by observed signals. You have to dig in and understand what may be producing a signal. There can be unusual features in the data such that it is unclear what’s going on or what’s causing a particular signal. An astronomer might say, “Oh, that’s probably just due to an instrument adjustment or due to increased stellar activity or due to the absorption of light from the Earth’s atmosphere.” There are definitely still unknowns.
To change topics a little bit, we met in 2015. You gave a great talk at Virginia Tech. You’ve had quite a career since then. Can you tell us about it?
After my PhD at UNC-Chapel Hill, I went to Carnegie Mellon in the statistics department for three years as a visiting assistant professor. I was excited to go there because they have a great group of statisticians who work in astrostatistics. That is when I was able to get involved in a variety of astrostatistics research, and it was so much fun!
In 2015, I started a faculty position at Yale in the department of statistics. I was there as an assistant professor for a few years and loved it . Yale is a really neat place for many reasons, and it is where I got into some of the exoplanet astronomy work I do today—because I was able to connect with excellent astronomers. Debra Fischer and her team were close collaborators. Debra is an amazing person to work with and has a contagious passion for exoplanet astronomy.
Then, my husband and I had our first child in 2019. I’m from Minnesota and my husband is from Iowa, so being in Connecticut was a bit too far from home. We were really missing the Midwest. I went back on the job market soon after having my son and applied to a few positions in the Midwest and was thrilled to get the offer from the University of Wisconsin. It seemed like a great fit for me research-wise, and the faculty, staff, and students I met were amazing. It is a nice big department with a variety of research interests—from applied to methodological to theoretical—with an emphasis on collaboration and interdisciplinary work. In addition, Madison seemed like a great place for our family. It ended up being the perfect situation for us. So then during summer 2020, we moved out to Madison during the pandemic. I feel so fortunate to have been a member of all these great statistics departments, and each one has had a significant impact on my research and academic career.
You recently won a National Science Foundation award through the Division of Astronomical Sciences. Can you tell us a little bit about that?
This is based on some of the exoplanet work that started with Debra at Yale and Eric Ford, who is an astronomer at Penn State and long-time collaborator. The three of us and our teams have been working to develop methods to detect low-mass exoplanets in the presence of stellar activity. I previously mentioned starspots and how these spots and other sources of variability in the atmosphere of the star can cause problems with detecting exoplanets or induce a signal that looks like an exoplanet.
Eric and I, along with our collaborator Lily Zhao at the Center for Computational Astrophysics, submitted this proposal to the National Science Foundation’s Division of Astronomical Sciences. Our ongoing goal is to detect low-mass exoplanets. There have been more than 5,000 exoplanets discovered. If you were to plot the mass of those exoplanets versus the discovery date, you would see that since 1995—when the first exoplanet was discovered (51 Pegasi b)—we’ve been able to detect lower and lower mass exoplanets. But the past decade’s minimum mass of detected exoplanets has kind of bottomed out. The issue is low-mass exoplanets leave a tiny signal in the spectra, which is very hard to detect. Part of the previous issue was the instruments were not yet capable of detecting such a small signal. Within the past 2–3 years, the instruments have improved so, in theory, we can detect those small signals.
But as the instruments improve, they also pick up more and more features of the star’s variability that cause problems with finding our planet signal. We proposed approaches for trying to control for the variability of the star to get out what we’ll call a clean radial velocity—or a better radial velocity—that hopefully captures the actual center of mass Doppler shifting due to an orbiting planet, instead of stellar variability.
Leave a Reply