
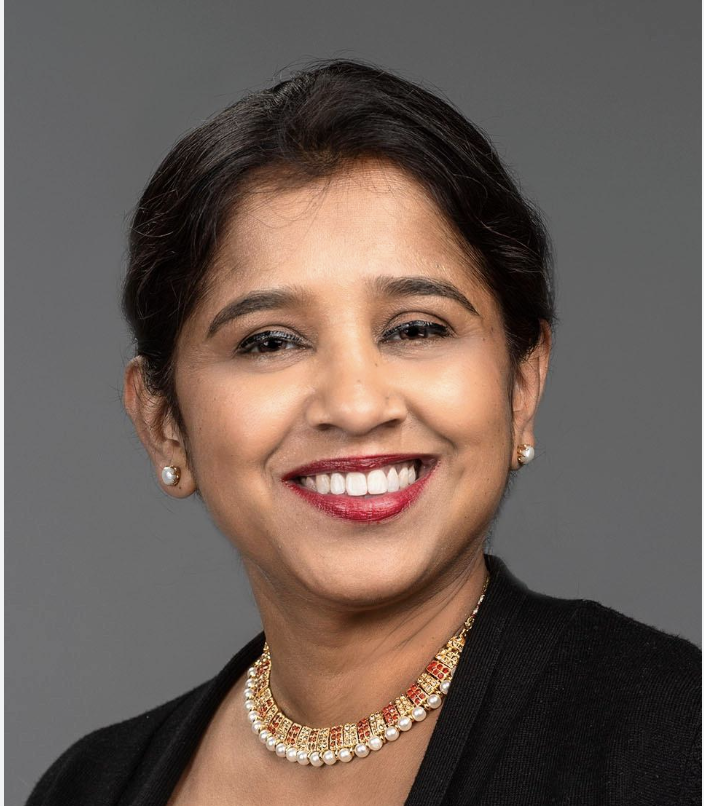
Friday afternoon of the April ASA Board of Directors meeting culminated in a LinkedIn Live event. Joined by International Prize in Statistics winner Nan Laird, the board premiered the first video from the Telling Our Stories series. Statistician and data scientist Maria Cuellar of the University of Pennsylvania Department of Criminology shared how—in partnership with the Innocence Project—she applies statistical thinking on errors and uncertainty to forensic science with the goal of reducing false convictions.
The video project—launched with Nan’s financial support—aims to highlight the profound impact of statistics on daily life, inspire a greater appreciation for its contribution to advancing science and enriching society, and raise awareness of the transformative power of our profession.
This innovative project is exciting on multiple fronts. First, it’s well aligned with the ASA’s mission to promote the practice and profession of statistics. Second, it exemplifies the partnership model between a sponsor (Nan) and the ASA for a common purpose. Third, it addresses an aspiration I have shared before: our responsibility to communicate our IMPACT.
In “Questions Answered: Bonnie Ghosh-Dastidar,” which appeared in the February 2023 issue of Significance magazine, I noted I have often found fellow statisticians to be humble, conscientious, and happy to work in the shadows. They devote little effort to highlighting their important contributions.
Another major barrier to increasing visibility is the nature of what we do: Our work is often complex, and it can be hard for nonstatisticians to understand or appreciate. We need to communicate our impact in ways nonstatisticians can appreciate—to tell the stories of how statistics affects the lives of real people every day.
Redefining Impact: Why Traditional Metrics Don’t Tell the Whole Story
Even as we find ways to increase our visibility by communicating our impact, we need to consider how we measure and maximize that impact. We can start by examining current definitions of and assumptions about what impact means. As a discipline, what do we perceive as impactful? What is incentivized or rewarded?
Traditionally, we have measured impact with quantifiable metrics such as grant funding and number of peer-reviewed publications. Obviously, these remain important. However, in recent conversations with statisticians and data scientists, I have often heard traditional measures might not fully capture the breadth and depth of an individual’s influence. In an era of mushrooming data, nuanced collaboration across disciplines is needed to address society’s greatest challenges. Statisticians and data scientists are positioned to play a central and essential role in this collaboration. Our work contributes to analysis in nearly every scientific field.
A major disadvantage of traditional metrics is they often favor individual achievement over team-based work; they may also fail to fully acknowledge the contributions of those who collaborate behind the scenes. A junior researcher who contributes significantly to a groundbreaking project might see their impact diminished by an authorship hierarchy. Educators who inspire their students and create positive learning environments might struggle to quantify these invaluable contributions. In addition, the contributions of those in nontraditional academic roles or industry scientists may not be sufficiently recognized within the statistical community. Redefining impact will require a shift in perspective. Recognizing the value of collaboration is an essential step toward developing metrics that provide a more holistic picture of an individual’s contribution.
Stories of Exceptional Innovation and Impact
Former ASA president Karen Kafadar mentioned she chose statistics “because it deals with real problems where statistics can make a difference” in her 2019 address at the Joint Statistical Meetings. In fact, this is why I chose to work in public policy. A consistent focus of my work has been to understand the mechanisms that drive health and social inequality. Inspired by the Telling Our Stories series and reflecting that focus, I want to recognize the following inspiring examples of statisticians and data scientists serving society and helping to improve lives.
Measuring Inequality and Discrimination
Why? The Affordable Care Act requires all federal data collection efforts to include information about race, ethnicity, sex, primary language, and disability status. The gold standard for race and ethnicity measurement is self-report, but missing or poorly measured race and ethnicity data can create barriers to monitoring and improving quality, coverage, cost, and access.
How? A statistical model to measure racial and ethnic disparities was developed by RAND statistician Marc Elliott and colleagues. The Bayesian Improved Surname and Geocoding (BISG) family of algorithms, which use data from the US Census Bureau and other sources, can be used in any data set with name and address to measure and compare racial and ethnic groups. These algorithms incorporate census surname and residential address data—and first name data and Medicare administrative information in some versions—to produce a vector of six probabilities of being Hispanic; non-Hispanic White; Black; Asian American, Native Hawaiian, and Pacific Islander; American Indian and Alaska Native; and Multiracial. The BISG achieves concordance of 92–98% for Asian American, Native Hawaiian, and Pacific Islander; Black; Hispanic; and White people and does a little better with first names data.
The Medicare BISG (MBISG) is a specialized version that incorporates additional Medicare data to improve administrative race and ethnicity measurement for Medicare beneficiaries. It requires Medicare data and has concordance of 96–99% for Asian American, Native Hawaiian, and Pacific Islander; Black; Hispanic; and White people.
Impact: These methods are widely used in a variety of settings by federal and state governments, researchers, and commercial interests. For example, they are used by the Centers for Medicare and Medicaid Services to identify and address racial and ethnic disparities in the clinical quality of health care in the Medicare population. They also help ensure equitable algorithms for health care decision-making.
Although this algorithm was devised for health care research, the Consumer Financial Protection Bureau used it to underpin racial discrimination allegations against auto lending companies (e.g., the former General Motors lending arm Ally Financial, which paid $80 million to settle in 2013). “There’s inherently some creativity involved,” Elliott said. “The challenge is to take a complex problem in the real world and figure out the parts you can translate into the realm of numbers.”
Algorithms for Human Rights
Why? Each year, an estimated 27–46 million individuals worldwide are held in modern slavery, generating annual profits of $30–$50 billion. “Trafficking is one of the most pernicious human rights and global health problems,” said Victoria Ward of the Stanford Human Data Trafficking Lab. Yet little is known about how the market for human trafficking works—and thus how policies might prevent it.
How? An interdisciplinary team at the Stanford Human Data Trafficking Lab—in partnership with Brazilian federal prosecutors—has developed a human trafficking data repository that integrates existing, disparate administrative data sets to gain an understanding of human trafficking markets and the impact of policies.
For example, Stanford statistician Mike Baiocchi and his team of analysts have developed a decision-support tool for targeting labor trafficking. The architecture is based on a data-processing pipeline that transforms a constant flow of satellite imagery, along with incoming trafficking clues from varied sources, to produce predictions of actionable trafficking risk. Methods include machine learning from artificial intelligence, statistics, and algorithms that try to identify and disrupt the corporate structures of those profiting from the exploitation of human beings.

Photo by Luis Fabiano de Assis, Brazilian federal prosecutor
Impact: The problem is massive. According to Walk Free Global Slavery Index, more than 1 million people are held in conditions of modern slavery on any given day in Brazil. Using advanced AI methods, Baiocchi and his team have helped locate labor camps in the Brazilian arc of deforestation and worked with law enforcement to safely remove exploited workers. This work also requires engagement with policymakers and frontline actors to identify the most effective solutions on a global scale.
After two rounds of successful piloting—during which the algorithms were used to locate and aid in field operations to rescue exploited workers—the lab is applying rigorous causal methods to assess the real-world impact of their tools in high-stakes investigations by Brazilian federal prosecutors.
“… [W]e’re listening and learning from how the prosecutors do their jobs,” Baiocchi said, “and we’re enabling machines to figure out a way to comb these huge data sets and automate and prepare insights for the prosecutors, to help prosecutors get into the field faster.”
Improving Public Trust in the US Census
Why? Mandated by Article 1, Section 2 of the US Constitution, the decennial census is how we count every resident in the United States. This is extraordinarily important because census results are used for apportionment, redistricting, and distribution of billions of dollars to states, counties, and communities. The 2020 census seriously undercounted the number of Hispanic, Black, and Native American residents while overcounting White and Asian American residents. Such inaccuracies have reduced public trust in census data.
How? In a blog post, Census Bureau Director and statistician Rob Santos described bureau-wide efforts to “include culturally diverse training and educational materials, and tailored, unique cultural approaches with historically undercounted populations” in the next census. The bureau is investigating how training helps field staff develop cultural competencies. The new outreach efforts for undercounted populations are to address issues encountered in the 2020 census. The undercounting of minority populations resonates with Rob, a Latino who is the first person of color to hold the top Census Bureau post. His task is to rebuild battered public trust in the census and achieve a more accurate count.
Impact: To articulate the impact of Rob’s work, I went back to a President’s Corner column in which he wrote, “I have often used a strategy I call ‘growing leaders.’ … I partner with a junior staff person to author a blog or bid on a project where we are co-principal investigators. I provide technical/statistical expertise, and my junior colleague provides substantive expertise. Over the course of the project, I create a ‘space’ and provide the nurturing that allows my colleagues to take the lead in every sense of the word (budget, schedule, project team supervision, client contact, analysis, critical thinking, report writing). My professional reward is seeing those with whom I work blossom into leaders and scientists.” This legacy of helping is truly a measure of impact.
These are only three examples of individuals who are using statistics and data science to make the world a better and more equitable place. But what these profiles clearly show is—if we want to demonstrate our impact—we need to broaden our definition of it by developing metrics to recognize our contributions to team science and real-world applications, incentivizing creativity and innovation to adapt methods to solve real problems, highlighting leadership as impactful, rewarding service on panels/committees, recognizing mentoring efforts to build the pipeline, and encouraging communications targeted to a nonstatistical audience.
Let’s tell our stories, so others will know the value of calling on professional statisticians and data scientists to drive discovery and inform decisions.
Leave a Reply