
David J. Corliss, Director of Peace-Work
In 2021, the US Census Bureau released a new diversity index as one of many tools to help people use and understand census data better. In my own research in data for good, the index has been useful in identifying factors with higher and lower diversity, measuring the positive impact a more diverse workforce has on business success, and investigating sociological issues and challenges related to diversity, such as self-segregation. As a number of DEI-related resources are being restricted or eliminated at this time, I will show what the Census Diversity Index is and explain how to calculate it independently for use by DEI researchers, advocates, and organizations.
Many people are familiar with biodiversity. A common metric for it is the Shannon-Wiener Index, which predicts the uncertainty in classifying an individual selected from a population completely at random. In demographic studies, however, the Gini-Simpson index is more commonly used. This metric, used by the Census Bureau among others, calculates the probability that two individuals selected from a population completely at random belong to different population subsets. It was first developed in 1912 by the Italian statistician Corrado Gini. Gini was a eugenicist who developed the index to fight against diversity. Its use today to promote diversity and its benefits is a fitting scientific response to the original application.
The Census Diversity Index is calculated as

Where ni is the size of each subgroup in the total population N. As an example, let’s look at the population of the United States as a whole. Data by race—in this case, from the 2020 Census—is put into a table and we calculate n (n-1):
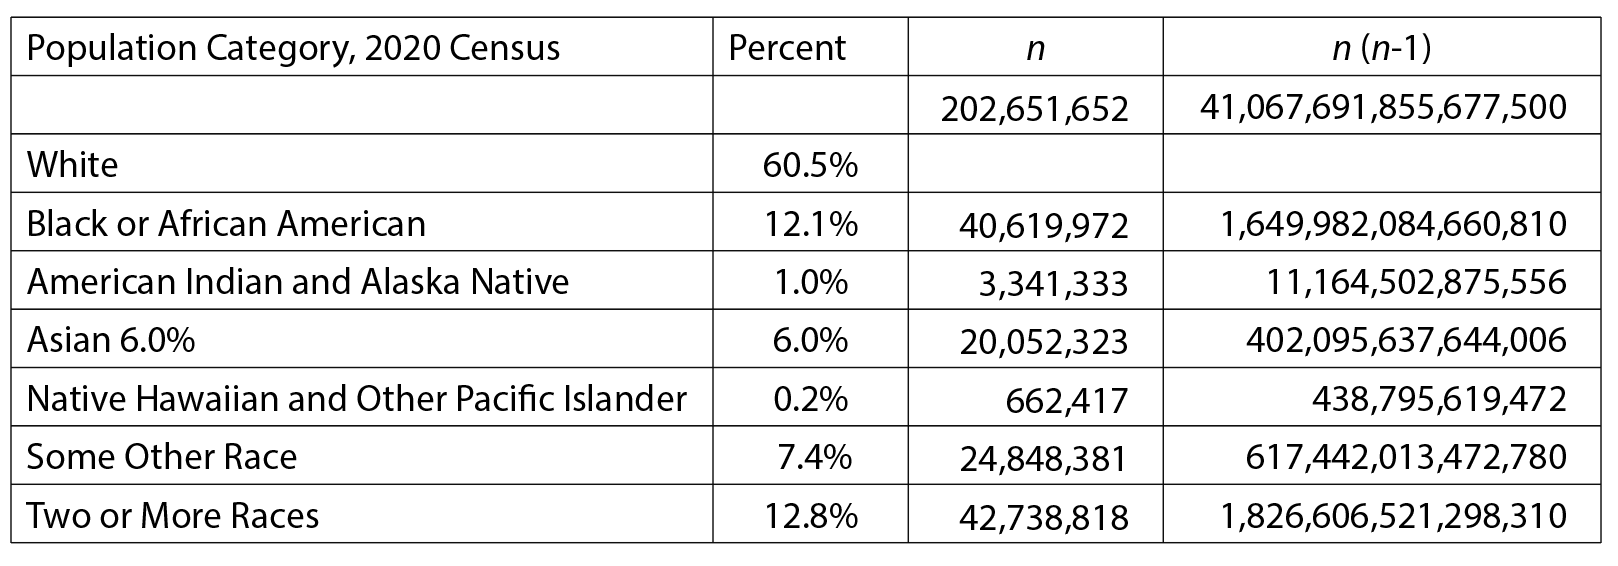
In the example, N is the total US population in 2020 = 334,914,896. Dividing N (N-1) by the sum of the n (n-1) for each category and then subtracting it from 1 gives the Census Diversity Index. For the US, the index is .440.
Applications
The taxonomy to be analyzed isn’t restricted to race; this statistical method can be used for any set of categories applied to a population to support a wide variety of applications. Tracking the diversity index over time often provides additional insights. Factors to be considered can include first language, urban vs. rural populations in a geography, job classes in a workforce—the possibilities are endless. Here is an example with a small, in-house opinion survey. A class of 28 students asked about their favorite flavor of ice cream:

Here, the ice cream preference diversity index is 1 – [(28 x 27) / 206] = 0.272.
Quantifying De Facto Segregation
Looking at racial diversity in detail within a given geographic area allows us to identify—and quantify—the effects of segregation. Here is the metric I will propose: the mean diversity index for regions within a geography divided by the index for the geography as a whole.
A good example of this is Wayne County, Michigan, which contains the city of Detroit. In the early 1950s, civic leaders in Wayne County, including in Detroit, divided the area along racial lines. This official segregation at the time has led to de facto segregation today. The diversity index for Wayne County is relatively high at .644, well above the US overall index of 0.440. However, analysis at higher resolution tells a different story. The index for Detroit and the five BIPOC (Black, Indigenous, and People of Color)-majority inner suburbs is .420. The index for the remainder of the county is .440, for an average of .43. Dividing this by the index for the county gives a segregation index of 1.43.
Conclusions
The Gini-Simpson Diversity Index, a methodology used by the US Census Bureau to calculate its diversity index, is a powerful tool for exploring diversity questions in a variety of areas. The calculation can be applied to demographics from government statistics, organizations, and surveys. We also find segregation, whether official or de facto, can be measured by the degree the average diversity index for subregions differs from the overall index.
Reach out to David Corliss, director of Peace-Work, with questions and comments.
Leave a Reply