
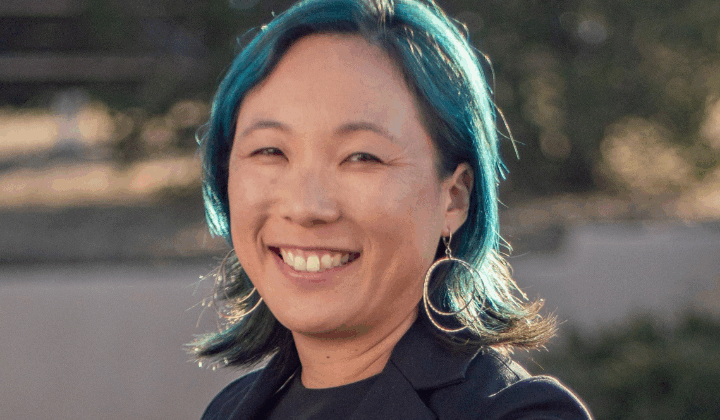
Claire McKay Bowen delivered the inaugural Dionne Price Public Lecture this April during Mathematics and Statistics Awareness Month. To commemorate this event, Bowen joined Practical Significance cohosts Donna LaLonde and Ron Wasserstein for an illuminating conversation about her statistical journey, the influential mentors who shaped her career path, and her perspective on what “statistics awareness” truly means in today’s data-driven world.

Donna LaLonde: Claire, tell us a bit about your day job.
Claire Bowen: My official title is senior fellow, and I lead the data governance and privacy practice area in the family and financial well-being division at the Urban Institute. The Urban Institute is a nonpartisan public policy research organization based in Washington, DC, focused on social and economic public policy issues like justice, housing, health, and tax. The Urban Institute was founded during Lyndon B. Johnson’s administration to study the nation’s urban problems and assess the impact of Johnson’s “Great Society” initiatives.
But then, what is my role as a senior fellow? I work on conducting different evidence-based public policy research. My focus is on developing technical and policy solutions for safely expanding access to confidential data, such as taxpayer data. One of my biggest projects is working with the Statistics of Income Division at the Internal Revenue Service.
My other hat is more managerial. I am the practice area lead for the data governance and privacy practice area. I help provide internal and external clarity about our organization’s work. I communicate our expertise and missions effectively and strengthen our impact. I also support employee development and a sense of belonging, facilitate cross-cutting projects and initiatives, and incubate emerging ideas and areas of work.
Donna LaLonde: What do you see as the role of statistics in serving the public good? How is it evolving as our society becomes more data-driven?
Claire Bowen: That is such a great question. I believe now more than ever, statisticians need to play a role or be more involved in our conversation about how society is evolving into a data-driven one. But I’m going to pause and say I’m not a fan of the term “data-driven” because we still need to have that human element. We should be talking about decisions being evidence-based or data-informed or thinking about what the story is. The human element is a key part, and we need to consider thoughtfully what the data are telling us.
Now to the heart of your question. In our society, many people see statistics and take them at face value without understanding where those statistics come from. As statisticians, we must be involved in that conversation to help people understand what data contributed to that statistic, how to interpret it, and what it means in practice. I’ve been saying for a while now that statisticians aren’t great at communicating or advocating for the work we do. We often get bogged down in technical details, like explaining how we came up with a regression model, which totally bores people. They want to know the story behind the statistics and how it can make a real difference in society.
For example, one of the projects I’m currently seeking funding for is aimed at improving access to mental health care for Spanish-speaking communities in Central Texas, particularly for pregnant women and mothers of young children. That’s more compelling than saying, “I’m going to apply data governance and privacy principles to protect longitudinal data.”
Ron Wasserstein: I’d like to hear about your mentors—one or more people who have influenced you—and how those experiences stand out for you.
Claire Bowen: I always recommend that students and early-career professionals have a roster of different mentors, because it’s hard to find one perfect mentor who can help with all the different kinds of challenges in your career or balancing your personal life.
And so, the same thing for me is that I have several mentors. The first one is my postdoc adviser, Joanne Wendelberger. She was great and influential in thinking about work-life balance. She told me about what it was like to be a mother of three and how that balanced with her work and becoming a manager at Los Alamos National Lab.
Jeri and Ed Mulrow have also been such great mentors in thinking through work-life balance and leadership. They both work in public policy research institutions. And I’ve talked to them about issues I’ve encountered at work and asked how they would resolve them. They’ve been able to give me some great advice.
Another person is someone who can help you navigate some of the political challenges at your work. I usually recommend finding a mentor who’s at work but not your supervisor. You want to find somebody who’s outside that chain of command who you can still talk with about the idiosyncrasies of your job, but who can provide advice and advocate for you. For me, that’s Len Berman. He’s been such a great mentor in helping navigate the intricacies at the Urban Institute. And Rob Santos, before he left to become director of the US Census. I do joke around that he advocated for me to take a management role but then said, “Oh, by the way, I’m going to become the Census Bureau Director, so peace out. You’re in charge now.” It wasn’t directly like that, but he kind of did that to me.
And then, finally, thinking about Sally Morton—she has also provided a lot of great advice to me about leadership and our role in statistics. She did work in public policy, as well. So, I got some great advice from her about how one might go about advocating for some of the policies we want to see with statistics.
Donna LaLonde: What initially drew you to statistics?
Claire Bowen: I started out studying physics because I wanted to understand how the world works, like knowing why the sky is blue and how airplanes fly, right? Those are some classic questions you hear in physics. However, within the first year of my college studies, I realized mathematics is the language of science. So, I pursued a dual degree in mathematics and physics at Idaho State University.
And after learning all these new math and science concepts, along with conducting some research on my own in a few labs, I started talking about them with my spouse, who was somebody I was dating at the time. He told me, “You seem to really enjoy statistics.”
It was that moment when I realized what I liked the most about research and trying to answer these questions was the analysis aspect. And so, to borrow from the famous quote from John Tukey about statisticians—I just like playing in other people’s backyards. I didn’t want to limit myself to just one field of science. It made sense because I kept hopping around different physics research projects. I was in a radiation physics lab. I worked in a biophysics lab, where I analyzed DNA and RNA interactions. I did some educational physics work, and I just kept hopping around. I thought, “Oh, this is all so cool. I can’t focus on one thing.” But statistics? You can explore them all. It is the key to learning about these different areas, especially in public policy. I can work on education, health care, tax policy, labor, economics, and much more.
Ron Wasserstein: What is the one fundamental aspect of statistics you wish everyone understood?
Claire Bowen: I’m going to start by paraphrasing a joke I’ve heard, which is there are liars, damn liars, and statisticians. In statistics, there are often two sides to every story, especially when we consider the full life cycle of data and how we think about collection, storage, transfer, analysis, dissemination, and, ultimately, the termination of that data.
So, getting to your question, I want people to understand where that statistic came from. That’s fundamental. For example, each summer I teach a class where I have students come up with two different statistics. It’s like an in-class activity. I say, “You each have a policy question. You must come up with two different statistics that are technically correct for that given question you’re assigned, but they seem to contradict each other or at least appear drastically different.” And the data must be US-based just because we’re focused a little more on US policy.
Some of the questions I pose for them are: What is the average student loan debt? What is the primary factor that causes homelessness? At what age are women less likely to get pregnant? One student who was assigned the last question shared how frustrating it was to find data that included women who smoked but didn’t account for that aspect of their life or other health factors that could impact women’s likelihood of getting pregnant.
He said something like, “This is really important because this is a global challenge—declining birth rates.” And so, we should have data and analysis that reflect these different health aspects if we want to address this global problem. This goes to the heart of your question. As we train the next generation of researchers, practitioners, public policy members, and just general members of society, we should be advocating for understanding the full life cycle of data and how it affects the statistics we report.
Ron Wasserstein: What advice would you have for people who want to get better at their technical communication skills?
Claire Bowen: Yes, the first thing I tell people is, “You need to figure out who exactly the audience is. Just saying your audience is ‘lay’ or ‘the general public’ is not useful at all.” Because when you create a dissemination product—like talks, blogs, reports, or peer-reviewed papers—for everyone, it ends up being for no one. So, if you find yourself referring to a lay audience as your target audience, it’s time to dig a little deeper. Are you speaking to someone in your community? Is it a local public policy official (which is different than a state or a federal-level official)? Are you thinking about being a health industry professional because you’re doing health care research? Or is it someone in agriculture? Is it a farmer, or someone implementing certain kinds of policy in agriculture? So basically, understanding your audience is key to trying to refine your communication approach.
And so, once you know who your audience is, think about the story you want to tell. This applies whether you are writing a blog post or a technical paper. Let’s go a little more on the technical side. For example, I just recently had a project meeting with a few of my colleagues, and we were discussing how we’re going to update a paper we’re submitting for a peer-reviewed journal. There are a lot of results, a lot of simulations, and some people try to cram them all into the paper because they think, “Oh, it’s a technical paper. It’s for peer review. That’s fine, we can just shove it all in.” But there’s a page limit. Also, not everybody who reads your work wants to slog through all those results.
So, the key focus here was identifying the story or message we wanted to convey. What do we want the researcher—statistician or computer scientist reading that paper—to take away? That helps guide us in selecting which results to highlight and telling that story or message we wanted to convey.
That’s the framework you need to think about. What level of technical difficulty or how broad you want to go. It’s like this inverse. If you want to reach a broader audience, you give less technical detail. If it’s a narrower audience, you can go more in-depth.
Leave a Reply