
Penny S. Reynolds
To honor UN World Toilet Day on November 19, we celebrate the statistical contributions (plus some missteps and false leads) of statisticians who helped build modern sanitation and public health systems. Basic sanitation measures have saved millions of lives, but approximately four in 10 people (more than 3 billion worldwide) still live without access to clean drinking water and adequate sewage disposal. And two in 10 lack access to private toilets.
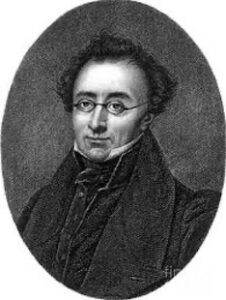
1824: Alexandre Parent-Duchâtelet (1790–1836) publishes the first rigorous, empirical map of the Paris sewer systems. He uses the “numerical method” (developed by Pierre Charles Alexandre Louis) and occupational cohort monitoring to document structural failures, health risks, and worker hazards. His work fundamentally changes contemporary understandings of disease, sanitation, and the role of sanitation workers as essential service providers. (Paris today is one of the few cities to have a sewer museum.)
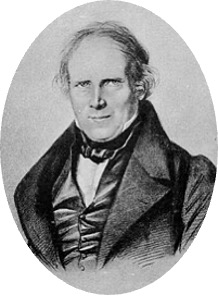
1829: Louis René Villermé (1782–1863), one of the earliest users of epidemiological spatial mapping to understand disease distributions, helps found the first journal of public health, Annales d’hygiène publique et de médecine légale (Annals of Public Hygiene and Forensic Medicine). The journal puts global attention on the sanitary reform movement by publishing groundbreaking epidemiological studies and statistical tracking of diseases backed by data from intensive field investigations.
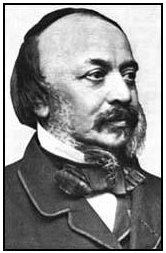
1842: Edwin Chadwick (1800–1890) publishes a report on the sanitary conditions of the working poor. Borrowing ideas from the French public health movement, Chadwick examines mortality as a population phenomenon affected by location and occupation. He argues that high premature death rates were largely preventable if sanitation could be improved. Although his statistical methods are criticized and later superseded by the likes of William Farr, his report is a crucial step in the translation of statistical evidence to public health policy.
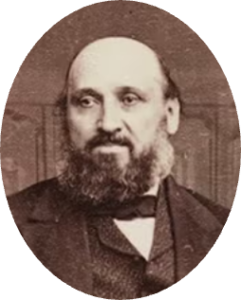
1849: William Farr (1807–1883), president of the Statistical Society of London from 1871 to 1873, derives a mathematical model, C = k /(e + a), expressing cholera mortality rate C as inversely proportional to mean housing elevation e. By grouping London’s registration districts into elevation “terraces,” the data neatly conforms to his model, providing evidence of the miasma theory of contagion. However, John Snow demonstrates the relationship is an ecological fallacy: The association between elevation and cholera mortality disappears when data is analyzed at the household level. Although Farr’s own analyses provide evidence that cholera originated from sewage-contaminated drinking water, he maintains his belief in the “all smell is disease” theory of miasma. Not until 1866, after Snow’s death, does Farr finally accept that cholera is a water-borne disease.
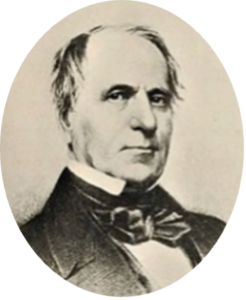
1850: Lemuel Shattuck (1793–1859), one of the five founders of the American Statistical Association, publishes a “Plan for a Sanitary Survey of Massachusetts.” Better known as the Shattuck Report, it is now recognized as the foundation of the American sanitation movement. Shattuck uses demographic and death records to link high mortality rates to unsanitary urban conditions and demonstrates the necessity of government oversight and intervention

1854: Florence Nightingale (1820–1910) takes temporary leave from the Institution for the Care of Sick Gentlewomen to superintend patient care at Middlesex Hospital, which treated many patients during the Soho cholera outbreak. The statistical innovations by which she is best known come later. The experience she gains here will enable her to develop her signature hyper-efficient medical triage and administrative systems in the Crimea. She’s later named first female Fellow of the Statistical Society of London in 1858 and honorary ASA member in 1875.
1854: John Snow (1813–1858) has the handle of the Broad Street pump removed. This action pinpoints the source of the Soho cholera outbreak and establishes cholera as a water-borne disease, not airborne as was commonly believed. Snow’s insights are more remarkable because they occurred 30 years before the definitive cause of cholera was established. His conclusions are based on extensive ground-truth research, statistical mapping, and spatial analysis, coupled with sound physiological reasoning.
1859: Florence Nightingale submits her report to the Royal Commission convened to investigate high mortality among soldiers during the Crimean War. While the report is an indictment of systemic failures that caused many preventable deaths, it also highlights the success of the 1855 Sanitary Commission, which slashed hospital mortality rates from 42% to 2% through targeted overhauls of sewage and ventilation.
Nightingale applied the analytical methods of Adolph Quetelet (data equivalence before comparison, isolation of constant from variable “forces”) in collaboration with William Farr, who prepared the data tables. Designed to make the maximum impact, the report is short and supported by compelling numerical evidence and her now-famous coxcomb diagrams.
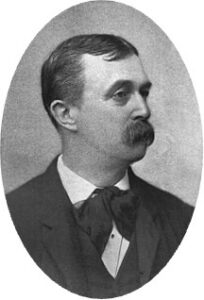
1890: John Shaw Billings (1838–1913) and colleagues complete their “vital statistics” survey of New York City and Boston. An important innovation is the creation of small, permanent, geographic units (sanitary districts) for statistical mapping of environmental and municipal factors influencing urban sanitation and disease transmission. With the change in focus of the 1910 census from public sanitation to demographic tracking, the US Census Bureau renames these units “census tracts.”
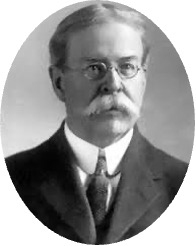
1892: William Thompson Sedgwick (1855–1921) and Allen Hazen (1869–1930) present their groundbreaking statistical track and trace analyses of the Chicago typhoid epidemic at the 53rd annual ASA meeting in Boston. They link the source of the epidemic to the sewage-contaminated municipal water supply. Their report is recognized as the beginning of American epidemiology.
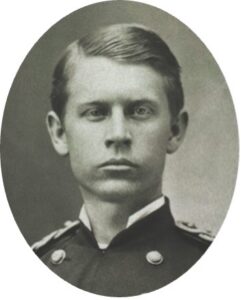
1898: Major Walter Reed (1851–1902) and two other members of the Typhoid Board investigate a typhoid epidemic in US Army training camps that killed more soldiers than combat operations. After correcting thousands of case records that had been misclassified as malaria and other illnesses, they calculate localized incidence and tent-to-tent transmission patterns that showed that typhoid spread through person-to-person contact and houseflies carrying contamination from human waste. Their findings lead to recommendations for stricter sanitation and infection-control measures. A preliminary report comes out in 1900, and the final report comes out in 1904 after Reed’s death.
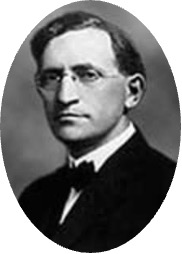
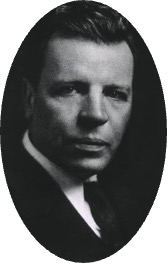
1920: Pellagra (the “forgotten plague”) was a debilitating, often fatal disease common throughout the southern states during the early 20th century. Joseph Goldberger (1874–1929) and Edgar Sydenstricker (1881–1936, ASA Fellow 1922) publish their study on South Carolina cotton mill workers, which demonstrates that pellagra was caused not by poor waste disposal as previously thought, but by dietary deficiency. Rather than relying on simple geographic spatial clustering and correlations typical of previous studies, Sydenstricker enables the correct conclusions to be drawn through novel analytical methods such as integration of multi-level data with interviews and food purchase records, control of confounding variables, and comparative group analyses.
Leave a Reply