

Starting with degrees in African American studies and sociology, Renée Hanson discovered a love for statistics that led her to R programming, data visualization, and ASA workshops.
data visualization
SDSS 2025 to Bridge Disciplines and Advance AI, Statistics, Data Science
The theme for the 2025 Symposium on Data Science and Statistics is “Bridging Disciplines: Advancing AI, Statistics, and Data Science Together.” Taking place April 29–May 2, 2025, at the Hilton in Salt Lake City, Utah, the theme reflects the transdisciplinary role statistics, data science, and now AI have integrated multiple disciplines to push the innovation boundaries of these rapidly evolving fields.
Designing Spatial Experimental Plots for Comprehension

Alison Kleffner explores innovative design solutions to overcome common visualization challenges, improving accuracy and insight in field experiments.
Data Exploration Through Time

Catherine Durso shows us how time as a dimension transforms static data into dynamic visual stories, enhancing our ability to interpret complex information.
Practical Significance Take Two—Talking Data Science in Science with Founding Editor-in-Chief

The ASA recently added the open-access journal Data Science in Science to its portfolio of publications and Practical Significance co-hosts Donna LaLonde and Ron Wasserstein interviewed the journal’s founding editor, David Matteson, during a recent podcast episode. If you missed it, you can tune in here.
ASA Data Visualization Poster and Project Competitions to Take Place in Spring
The competitions offer opportunities for students to formulate questions and collect, analyze, and draw conclusions from data. Winners will be recognized in Amstat News and receive plaques, cash prizes, certificates, and calculators.
JEDI Corner: From Visualization to ‘Sensification’

Data visualization and exploratory data analysis have been recognized in recent decades as important parts of statistics, but visualization excludes people with visual impairments, an increasingly important issue as the population gets older. How can statisticians and analysts provide some of the benefits of the dataviz revolution?
UConn Sports Analytics Symposium Boasts New Features
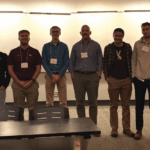
The fourth UConn Sports Analytics Symposium was supported by a three-year conference grant from the National Science Foundation and included a data challenge.
August Issue Features Data from Middle Ages, Data Viz Heroes
Digging for data from the medieval ages occupies James Walker, John Lee, and Stephen Broadberry in the August issue of Significance. They use ancient statistical documents, including arguably the most famous of them all—Domesday Book, published in 1086—to painstakingly reconstruct the medieval economy.
What’s Going On in This Graph? Begins Sixth Year
Led by Sharon Hessney and designed for students in grades 7 and above, the program helps teachers lead class discussions about graphs appearing in The New York Times.