
• Skip to main content
  • Skip to secondary menu
  • Skip to primary sidebar
  • Skip to footer
  • Homepage
  • About Us
  • Advertising
  • Submission Instructions
  • Editorial Calendar
Amstat News

Amstat News

The Membership Magazine of the American Statistical Association

  • Printed Issues
  • Practical Significance Podcast
  • Additional Features
  • Columns
  • Member News
  • Departments
You are here: Home / Additional Features / Newest Book in ASA-CRC Series Covers Data Visualization

Newest Book in ASA-CRC Series Covers Data Visualization

October 1, 2018 Leave a Comment

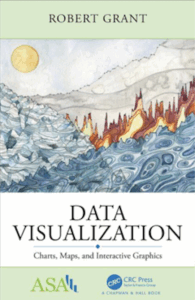
The latest release from ASA-CRC.

The third book to be published in the ASA-CRC Series on Statistical Reasoning in Science and Society is Data Visualization: Charts, Maps, and Interactive Graphics by Robert Grant.

The book is concise, filled with full-color visualizations, and focuses on concepts and ways of thinking about data, rather than algebra or computer code. It features 17 short chapters that can be read in one sitting; each is self-contained, so the reader can easily dip in and out of the book. Topics included are big data, statistical and machine learning models, visual perception, high-dimensional data, and maps and geographic data.

Whether you are a student considering a career in data science, an analyst who wants to learn more about visualization, or the manager of a team working with data, this book will introduce you to a broad range of data visualization methods.

For details about the book, visit the CRC Press website. To learn more about Grant, visit his website.

Do You Have a Book Idea?

The ASA-CRC series contains short books covering the use of statistics in wide-ranging aspects of professional and everyday life, including the media, science, health, society, politics, law, education, sports, finance, climate, and national security. The books present concepts assuming minimal mathematical background and can be read by a broad audience.

For details about the aims and scope of the series and to get in touch with the editors with your ideas, visit the ASA-CRC website.

Filed Under: Additional Features Tagged With: ASA/CRC Press series, big data, CRC Press, data visualization, high-dimensional data, maps and geographic data, Robert Grant, statistical and machine learning models, visual perception

Reader Interactions

Leave a Reply Cancel reply

Your email address will not be published. Required fields are marked *

Primary Sidebar

Search

More to See

Jennifer L. Green: The Collaborative Life of a Statistics Professor and Teacher Mentor

September 1, 2026 By Megan Murphy

Meetings, Manuscripts, and Meows: Spend a Day with Charlotte Walsh

September 1, 2026 By Megan Murphy

Students’ Statistical Thinking When Using Generative AI

September 1, 2026 By Megan Murphy

What Students Taught Me About Teaching Statistics

September 1, 2026 By Megan Murphy

STATAcorp. Efficiency matters. Stata is easy to use, so you spend less time learning software and more time focusing on your research
Data Science Certification

ASA HOME

American Statistical Association

Communications from the Executive Director

ASA Leader Hub

ASA Career Connect

ADVERTISERS

STATA
SIAM

Archives

Categories

Footer

Editorial Staff

Managing Editor
Megan Murphy

Graphic Designers / Production Coordinators
Olivia Brown
Meg Ruyle

Communications Strategist
Val Nirala

Advertising Manager
Christina Bonner

Contributing Staff Members
Kim Gilliam

American Statistical Association
277 South Washington Street, Suite 370
Alexandria, VA 22314-3646
Phone: (703) 302-1857


Copyright © 2026 · Magazine Pro on Genesis Framework · WordPress · Log in